Showing posts with label Analysis. Show all posts

Wednesday, 6 August 2014

My Guilty Travel Secret

 
‘carbon guilt’ illustration by Stephen Collins
I have a guilty secret. I recently wrote about one my travel decisions: the decision not to fly. As I explained then, my decision to no longer use air transport was made because I found the environmental impact of aeroplane use to be too high. When I shared that post with friends on Facebook it drew some support, some admiration, some critique and a need in many to justify their own use of aeroplanes. I didn't seek to criticise others, as Bill Mollison wrote 'The only ethical decision is to take responsibility for our own existence and that of our children. Make it now.' I take that seriously - I am responsible for my existence, you are responsible for your existence.

I have a guilty travel secret. I use trains. I use trains a lot. In the last couple of years my partner and I have holidayed in France taking National Rail, London Underground, Eurostar, TGV and TER  trains from our home to the Ardeche (in 2013) and to the Cote d'Azur (in 2014). But this is is not my guilty secret.

Those holiday journeys pale in significance when placed in the context of my regular weekly train use. My name is James and I am a commuter, it's been 3 hours and 45 minutes since my last train journey. A searching and fearless inventory of my usage requires a thorough survey.

I live in a small town in Essex and I work in central London. Everyday Monday to Friday I walk to my local branch line station and board a train into the metropolis.


If it's what we do each day that defines us - this is what currently determines me. And it's an activity that adds up. I leave our home at about 8.20, board a train at 8.37, arrive at Stratford about 9.16, transfer to to the London Underground and take the Central Line to Tottenham Court Road station from which I make a 5 minute walk to my workplace.


I leave work at 18.00, walk back to Tottenham Court Road station, take the Central line to London Liverpool Street where I board the 18:41 train home, I get to South Woodham Ferrers around 19.25 and walk back to the house to get in by 19.40.

What's the impact of all this travel? How might I analyse my survey data?


Daily CommuteDistance (Km)Carbon Emissions (KgCO²e)Carbon Conversion Factor (KgCO²e per passenger/Km)
Outward Journey (train)48.28032.3676659120.04904
Outward Journey (tube)10.530.66981330.06361
Return Journey (train)54.71772.6833560080.04904
Return Journey (tube)3.790.24108190.06361
TOTAL117.3185.96191712

Every workday I travel 117km by powered transport, leading to the equivalent of 5.96 kgCO² emissions. I work 224 days a year at this job, meaning my annual commute involves traveling 26,279.23km with concomitant emissions of 1,335.47 KgCO²e. [see below for data sources].


It's not the only rail travel I make.

As a trustee of the Permaculture Association I make two round trips to Leeds by train a year (totaling 1,178.04 km) and four additional round trips into central London - so my total rail travel as a trustee  is about 1,647 km.

Early this year I taught on a Permaculture Design Course (PDC) in London for 12 days across 6 weekends. Each day required additional travel from home into London, with rail travel of about  1,369km.

My previously mentioned holiday in France earlier this year involved rail travel totaling about 3,022km.

I know that I make more rail travel than this in an average year. At the weekends I will frequently make short local journeys by train, less frequently I will travel into London and back and make several tube journeys. Some workday evenings will involve additional tube travel. Across the year I am also likely to make some weekend travel across the UK to attend events or visit friends. I have found these journeys hard to enumerate but have estimated that in any given year these will involve travel of another 4,000 km.

Adding all these pieces of rail travel together, I get the following results:

Type of TravelDistance (km)Carbon Emissions (KgCO²e)Carbon Emissions (tCO²e)
Annual Commute26,279.231,335.471.335469435
Trustee Travel1,647.3181.620.08161875008
Holiday in France3,022.4426.840.02683848202
Travel for PDC1,358.7067.290.06729352699
Other Rail Travel4,000.00225.300.2253


TOTAL36,307.681,736.521.736520194

My annual travel, just by rail, results in equivalent CO² emissions of 1.73 metric tonnes - with my commute alone creating 1.33 metric tonnes of those.

Rush 'hour' on the Central Line, standing room only & currently 34.8°C, 45% RH
Being a commuter is both poor energy efficient planning and poor use of relative location. Two major elements of my life (my home and my workplace) are situated at a great distance from each other making it difficult to establish beneficial relations between the two. A large amount of energy* is required to transport me 117km five days a week leading to the production of waste in the form of atmospheric emissions and poor Earth Care. The daily grind and being away from home 12 hours a day isn't too great for People Care either, the journey is tiring and frequently frustrating with delays beyond my control extending my working day - I've also less time with my partner, family and friends and less time for housework, exercise and creative activity. According to the Office of National Statistics, commuting makes you 'unhappy and anxious'. There are also large financial impacts resulting from commuting, my annual season ticket currently costs £4,764 and will rise by inflation (RPI) on 1st January 2015** while my salary rises at just 1% a year (if I'm lucky!). My commute currently costs about 25% of my take-home pay. The profits made from me by Greater Anglia will largely leave the country to go to parent company Abellio (Nederlandse Spoorwegen) in the Netherlands.

But most significantly, according to United Nations projections, by 2050 the annual carbon emissions of every person on Earth must not exceed 2 metric tonnes, if we are to keep global temperatures in the 'safe zone' below 2 degrees above the pre-Industrial Revolution average and maintain Fair Shares of the atmospheric commons. As my annual rail travel alone is close to that figure, and my commute alone is over half of it - the way I travel is clearly not sustainable - this is my guilty secret.

Tune in next time, as I move on to design decisions!


*(All of the trains I have used are electric, offering the future opportunity for them to be powered entirely by renewable resources - but currently they reflect the UK and France energy mix and also use a range of non-renewable (coal, gas, nuclear) fuels. A change to an entirely renewably resourced service is inevitable eventually, but the national infrastructure requirements will be large, carbon intensive in construction and that eventual service may look very different to today in both scale and type.)

** Exact figure to be announced on 18th August, given that RPI was 2.6% in June, fares are expected to go up by over double my likely 2015 cost-of-living rise taking my annual fare to £4887.86 - spitting distance of £5 grand, a figure it will inevitably top the following year..


Data Sources


Wednesday, 26 February 2014

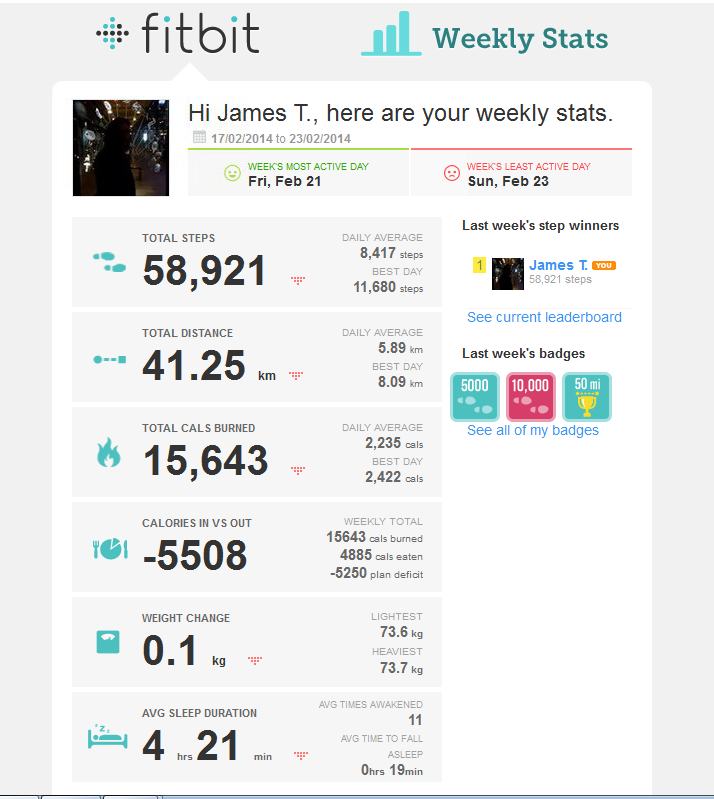
Fitness: Stats February 2014


The automatic monitoring facilitated by my Fitbit flex and the Fitbit online dashboard application is delivering some really useful information. I'm trying to feedback this into my actions to improve my results through evaluation and tweaking (apply self-regulation and accept feedback). All of the stats above appear to be good renderings of reality, apart from...  
  • Calories In vs Out (the Calories In bit is not automated and requires me to enter all the food items I consume and record their nutritional information, this is not always easy to do, when I do it - and it's an area that I don't always do - it's easy to forget or overlook as it's time consuming and fiddly).
  • Sleep Duration (the Fitbit records movement in my sleep as time awake, my subjective take is that it may well reflect restlessness but generally doesn't reflect a wakeful state)
The statistic I've observed most acutely has been daily Steps. The NHS Choices website states that: 'Research shows that walking 10,000 steps a day will significantly improve your health. Putting one foot in front of the other can build stamina, burn excess calories and give you a healthier heart.' I've taken this as a good base peoplecare goal for fitness, to build subsequent exercise on. The Fitbit also includes a goal system, with 10,000 steps as the default - and seems to record steps accurately. The Fitbit dashboard records and reveals my sedentary existence, here's my steps from Monday 24th February:


The first rise at 7.30 am is me getting up, the first burst of yellow walking from home to the train station - then it flat lines again for my train journey, until more activity between 9 and 9.45 as I navigate from train to tube and then from the tube station to work. Then it's pretty flat again until about 1.45 pm when I go to lunch and walk around outside until 2.45 when I'm back at the desk. At 6pm I reverse my commute, with a last burst around 7.30pm as I walk from the train station to home. That day I walked a total of 8,528 steps a little above my weekly average of 8,417. Given how little I actually seem to move around, I was unsurprised that my average was below the recommended 10,000 - what did surprise me is that according to that NHS Choices piece 'The average person walks between 3,000 and 4,000 steps per day'  - so what the hell are they doing all day? (driving door-to door to desk jobs I guess).

So, I've looked for some small and slow solutions to getting some more steps into my day. On weekdays I've got plenty of limiting factors to design around, these are my main boundary conditions:
  • Hours I'm asleep: Wake up c.7.30 am, go to bed c.12am - 7 hour 30 mins a day.
  • Hours I'm commuting: 3 hours a day
  • Working hours: 8 hours 15 mins a day (including 1 hour lunch break)
  • Meals: 3 meals a day at 30 mins each: 1 hour (1 at work accounted for above)
  • Ablutions, dressing & undressing: 30 mins a day
Total of the above is 20 hours 20 mins - leaving me a resource of 3 hours 40 mins to get some more steps in (and do everything else I want to do in my life). If I eat my lunch in 30 minutes, I can add another 30 minutes as available time, giving a total time resource of: 4 hours 15 mins.

So where is this time:

7.30-8.00 Breakfast
8.00-8.25 Getting washed & dressed
8.25-9.45 Commuting to work
9.45-1.45 Sat at desk at work
1.45-2.15 Lunch
2.15-2.45 - 30 mins
2.45-6.00 Sat at desk at work
6.00-7.40 Commuting from work
7.40-8.10 Dinner
8.10-11.55 - 3 hours 45 mins
11.55-12.00 Getting undressed, teeth brushing
12.00-7.30 Sleep

It's in my lunch hour at work and between eating dinner and going to bed at home. I'm aware that this picture is not completely accurate either, there are occluded factors:
  • I'm already walking most of that 30 mins in my lunch hour, so it's 'available' but the steps are already recorded. (One lunchtime I stayed in (no walking about) I only did 6,500 steps)
  • I don't eat dinner as soon as I get in, I may 'decompress' from my commute for 30 mins to 1 hour before eating.
  • Dinner taking only 30 mins is dependent on my partner doing all the preparation and cooking which is inequitable (not a fair share of the work, and not good peoplecare for a relationship).
  • Doing the washing-up is not accounted for.
  • Sometimes I'm so knackered I go to bed at 10.30pm not 12 am.
  • For a lot of the year (as now) this evening period is after dark, cold & not very inviting for walking in.
  • My commute is subject to regular delays adding to my journey times.
  • When I'm late for work as a result, I have to make the time up with a longer working day
Despite all this there are weekdays when I have walked in excess of 10,000 steps - including a'best day' of 11,295 (the 11,680 best day listed above was a Saturday). So what made those days different? I've identified three factors associates with weekdays I walked 10,000+ steps:
  • Days I scoffed my lunch/eat while working and walked most of my lunch hour.
  • Days I didn't go straight home, but stayed out and did stuff in London before going home.
  • Days I went home - then went out to the shops and back for some necessary food item.
Actually those extra 1,500-2,000 steps don't take long to do - 1,000 steps is the equivalent of around 10 minutes of brisk walking - so I only need to find 15-20 minutes. It's tempting to try and fit this in in lunchtime, but I'm conscious that the repercussion is not very mindful eating - an undesireable outcome. The elephant is of course, that 10,000 steps is only a beginning - when can i fit in any other exercise on top of 10,000 steps?

I frequently go out walking during my lunch hour, generally following the same few routes. To make walking more interesting I think I need to mix it up a bit more. To find where I can get to in the time I have, requires a bit of survey and analysis. A local street map and knowing my walking pace provides survey data, analysis requires crunching these pieces of data. A useful visual presentation of this analysis is a different kind of map - an isochronic map. I'm fortunate that London is well supplied with ready-made isochronic maps for walkers, generated by the wonderful Legible London project - a pedestrian wayfinding system to help people walk around the capital. [I think this project is a triumph of design thinking, read about how it was developed in Legible London - a wayfinding study]. One of the Legible London isochronic walking maps is situated near to my workplace providing a good indication of the boundaries of where I could get to and back in 30 mins.


This Legible London is a great free resource, but is limited in a few ways:

  • It only indicates a 15 minutes walk perimeter
  • It cannot indicate the likely timing of any particular route through the 15 minute zone
So if I want to walk for longer than 30 minutes, or take a route other than from where I am to the perimeter and back I'm on my own with the details. A complementary source of isochronic mapping is the website Walkit. Walkit features an urban walking route planner (for London and several other UK cities) which can provide route maps between any two points, including the journey time, calorie burn, step count and carbon saving. It can also provide circular route maps based on walking pace and available time. Here's a route from and to my workplace taking c.1 hour at a 3mph walking pace:


Walkit has free and subscription options, the above route map was available free. Subscribers to walkit can generate 5 different circular walks, of the same length, from the same point; generate an isochrone around any postcode in covered cities by time or distance' and a range of other benefits (£15 a year/£1.50 a month). I'm tempted by this extra functionality, but I'm also tight! - so I haven't signed up. In any case, common sense, existing knowledge of the city and experience as a walker provides me with heuristics to intuit my own isochrone. That said, just looking at and thinking about the Legible London and Walkit maps has improved my time sense of the landscape around where I work. Following Bart Anderson's re-interpretaion of permaculture zoning for urban areas, the walking isochrone represents the 'pedosphere' of Zone 1.


I am continuing to track, evaluate and tweak my path towards my weight-loss goal. Just altering my diet has proved quite successful so far, with a weight loss of 3.1kg since beginning in January. The rate of loss has slowed hoever, pointing towards the need for more physical activity.


I'm nearing the 'safe zone' of BMI, but still a way off my weight goal. Exercise is the clear tactic for increasing my liklihood of achieving this goal, but I need to find  ways of designing this into my life in a sustainable way. Many comments on facebook below a post on my previous personal health blogpost, 'Fat is an Ecologist Issue', suggested exercise practice that worked for the commentators. My next step is to review these to see if they might work for me, and consider other ways to increase my activity level.


generate 5 different circular walks, of the same length, from the same point
Read more at https://walkit.com/circular-walks/#8fkCTOl8Id4kIXKJ.99
route map between any two points, including your journey time, calorie burn, step count and carbon saving. It’s quick, free, healthy and green.
Read more at https://walkit.com/#HIF7X2E7VKZivdBP.99
route map between any two points, including your journey time, calorie burn, step count and carbon saving. It’s quick, free, healthy and green.
Read more at https://walkit.com/#HIF7X2E7VKZivdBP.99
route map between any two points, including your journey time, calorie burn, step count and carbon saving. It’s quick, free, healthy and green.
Read more at https://walkit.com/#HIF7X2E7VKZivdBP.99

Twitter